Technology
JUSDA’s 2020 GS1 Hackathon Project
The GS1’s mission is to define supply chain standards related to barcoding, product identification, and data sharing. In September 2020, GS1 US held their second annual hackathon which explored how to achieve more resilient supply chains during times of crisis. The hackathon offered four specific challenges including one which focused on consumer-packaged goods. Since JUSDA has been thinking a lot about how to optimize consumer fulfillment as part of the Component to Manufacture to Consumer value chain, we decided it would be a great exercise for our technology team to participate in this hackathon.
A key area of research for us recently has been exploration of methods to identify demand signals. A demand signal could be defined as either a completed consumer purchase, or identification of a consumer’s intent to purchase a product. In our connected economy a massive amount of data is becoming available, and if paired with the right analytics tools, could result in a higher level of visibility than has ever been possible. Better insights into demand is key to adapting to crisis. The pandemic triggered massive demand for cleaning products and personal protective equipment. The wildfire problem in California has triggered demand for air purifiers due to the resulting bad air quality. Often retail buyers, distributors and logistics providers do not expect these kinds of spikes in demand until it is too late. As demand signal data sources become more sophisticated, supply chain managers will become better at recognizing these consumer purchasing patterns during times of crisis. A key question is how can they actually respond?
The answer cannot be to simply increase production and ship more product to fulfill demand spikes. Constraints like manufacturing capacity, lead times, and shipping capacities cannot be suddenly overcome simply because demand for a product has surged. Factories may be able to speed up production somewhat, but there are so many dependencies that can limit this. Perhaps raw materials or components which are inputs into the production process are limited to the current daily supply. Maybe trucks moving in and out of the factory are limited by traffic congestion, the number of dock doors, or by fleet size. There are countless variables that need to be adjusted to increase production of supply and it only takes one stubborn constraint to block the whole process.
A more addressable problem is the inefficient matching of supply and demand during times of crisis. Events like natural disasters, political conflict, social unrest, labor disputes and public health crisis tend to impact geographic regions differently. Demand for particular products may spike in one region, while at the same time a large surplus of supply may be building up in a different region. Therefore, we believe tools that help identify these imbalances in real time are critical to achieving more supply chain resiliency.
Our solution in the GS1 Hackathon focuses on solving this problem with two tools: supply-demand correlation and real-time analytics. The GS1 standards include the EPCIS data exchange format which defines a consistent way for trading partners to communicate about product status as it moves through the supply chain. We considered how we could compare these EPCIS events with demand signals to help logistics managers quickly adapt in a crisis. One problem we recognized is that it is difficult to correlate these supply events with demand signals. The Global Trade Item Number (GTIN), defined by GS1, is a standard method of identifying products in a supply chain. There are various levels at which GTIN’s can identify products: by class, by lot, or by serial number. Another commonly used standard is the Serial Shipping Container Code (SSCC), also defined by GS1, which identifies a shipping unit like a pallet or carton which may contain one or more products. In the consumer-packaged goods scenario, most supply event data will identify products using these methods. The challenge is how to correlate this data with demand signals which may identify the product in a completely different way. Perhaps the demand data may use a seller’s own product code (like an Amazon ASIN), a product category (like “video game consoles”), or other types of product identification (like a Harmonized Tariff Classification). Also, location master data is also tricky to correlate. Supply data might reference the street address of the last known distribution center where a product was scanned. Demand data may reference the latitude and longitude of a retail location where the point-of-sale data was captured. A supply and demand matching function must support a flexible set of rules to correlate the master data between the supply and demand data.
The second feature of our solution is to use real-time analytics. For many organizations, the speed at which data is received and processed is far too slow to realistically improve supply and demand matching. As the number of potential data sources for supply and demand data grow, it is important that any technical solution can handle a large volume of data in real-time. The technology to achieve this has become easily available in the form of cloud services. In our solution we leverage Google Cloud Functions and the Firebase Cloud Firestore real-time database so that we can easily scale to process a large volume of events and provide data visualizations that update in real-time as new events are detected. That provides up-to-the-minute situational awareness to help logistics teams quickly respond to mismatches between supply and demand.
For our solution we developed a process that randomly generates supply events for a product that’s being produced in China, shipping via ocean freight to Long Beach port, and then either delivered to retail locations in Southern California, or shipped via rail to Chicago for retail consumption in the Midwest. We also randomly generate demand signals for the Southern California or Midwestern regions for three sales channels. We set the random number generator so that we see spikes in demand that are similar to the uncertainty of a crisis like a natural disaster or pandemic.
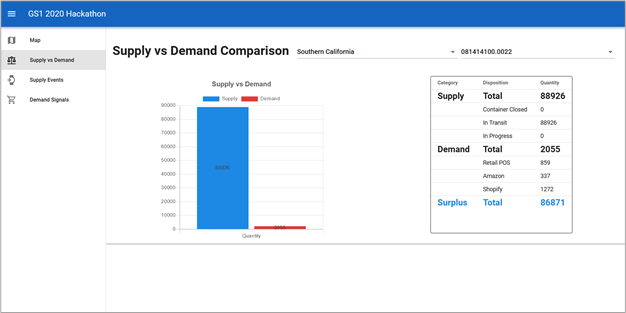
Our first data visualization compares supply and demand for a product in a particular region. The bar chart makes it easy to visually identify surplus or shortages. We display the total supply and a breakdown by the supply event disposition. Demand is broken down by signal type, which in this case is the sales channel. Products can be selected using their GTIN code, and it is easy to switch the analysis from one region to another. As our simulation runs, the charts and table values are instantly updated.
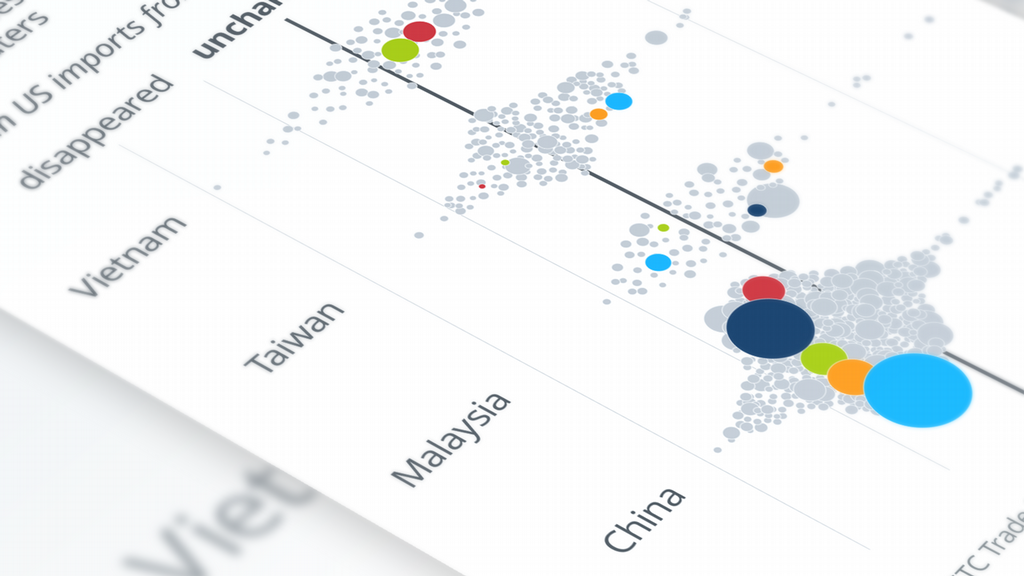
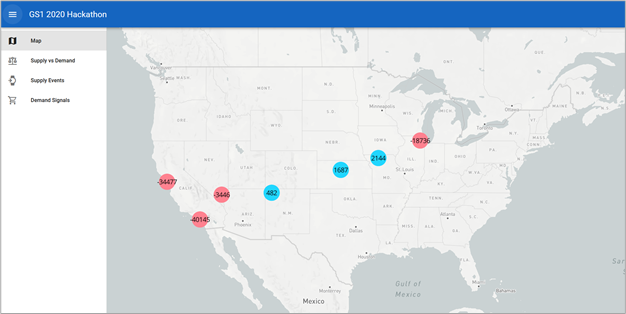
Our real-time map displays supply and demand globally, regionally, or at a site level. Blue dots indicate surplus at a location, and red dots indicate shortages. We can see in-transit and on-hand supply, as well as demand hotspots. As you zoom in, the dots are updated based on the zoom level so you can see where supply and demand are located on the map.
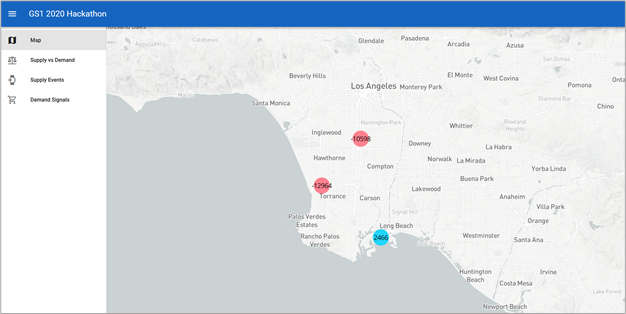
In this example, we have shortages at two Walmart stores in California and supply that has arrived from Shanghai at Long Beach port. Upon seeing this, a logistics manager could choose to divert this supply to adapt to the spike in demand.
By visualizing supply and demand data in real time, our solution makes it possible to improve agility and support better adaptation to crises. We believe this is key to improving supply chain resilience for consumer products. This solution is functional but of course purely a conceptual prototype. However, we believe the ideas we have presented could be part of a real-world solution to the increasing number of crises we are seeing. As more high-quality low-latency sources for supply and demand data become available, organizations that can develop this type of real-time correlation and analytics tool could have a big competitive advantage.
The JUSDA Technology team enjoyed participating in this hackathon and learned a lot from the resources the GS1 provided. We want to thank GS1 for putting on this hackathon and for awarding us first prize in the competition. The GS1 standards are a critical piece of a more resilient supply chain and we encourage everyone working in supply chain to learn more about how you can use the GS1 standards to improve your business.