Ocean Freight
Q1 2021 Ocean Summary Pt. 1
To help decision making in 2021 below are JUSDA indication of where the transportation market is heading.
Ocean
Trade tensions with China continue to remain on the same path. With Section 301 tariff exemptions having expired for certain goods in list 1, 2 and 3. Importers rushed to get goods shipped before the end of the year. The shortage of containers into China has led to rates at record high prices and introduction of new surcharges in the Transpacific trade lane.
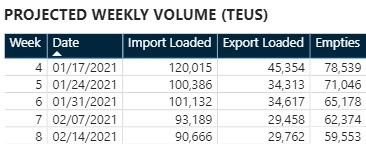
Projected volumes into Long Beach seem to be dropping as indicated by the weekly advance volume estimate.
We believe this is because of the drop in vessel calls (extra loaders approx. 10-15 per week that took place in Nov and Dec). However, this does not indicate shippers will see ocean rates go down as the Transpacific Westbound and Eastbound is still imbalanced.
When comparing Q1 2019 versus Q1 2020, the volume drop can be correlated with the impacts of COVID-19 and the shutdown that took place in much of the Far East factories along with traditional Chinese New Year shutdown. In the second half of 2020, volumes increased hovering between the 9-20% range MoM. As we look towards Q1 2021, our estimates indicate volume may dip as seen traditionally after CNY, however, this is not an indication prices will follow as equipment imbalance remains a challenge. We do see relief in the pipeline during Q2 with carriers launching new service strings into US. I.E. (THE Alliance) launching Asia to U.S. Gulf in Spring 2021. What is important to load is carriers are driving the distinction between a premium service and standard service. Notably following the consistent and reliable Matson service from China to US. Look to premium prices for MSC, Santana service or CMA-CGM’s Sea Priority Express to supplement the inconsistency currently in the ocean market.
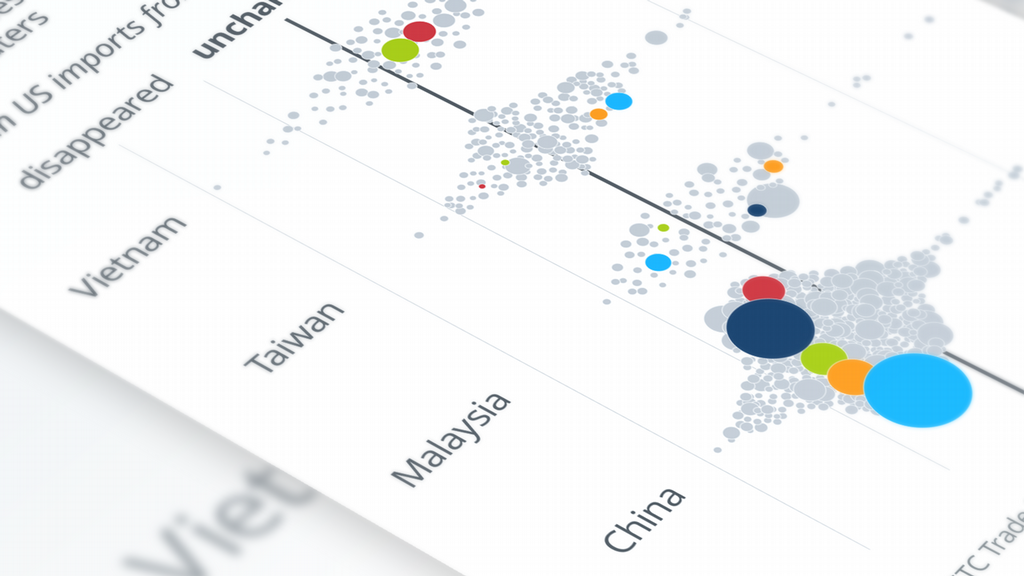
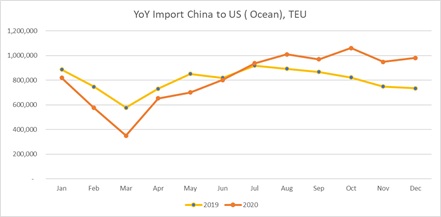
Two of the major countries JUSDA tracks for Import/Export imbalance is China and Vietnam into US.
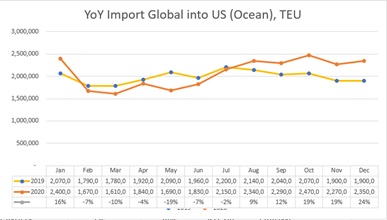
When comparing to the global volume into US the trend is consistent with July 2020 being a major turning point of when volumes steadily rise from 13% YoY Growth to a max of 34% increase YoY. This increase we believe can be corelated back to April of 2020 when COVID-19 lockdowns in China ended and production capacity came back online. Lead times of 30-60 days out is typical in our industry from component to mfg. hubs.
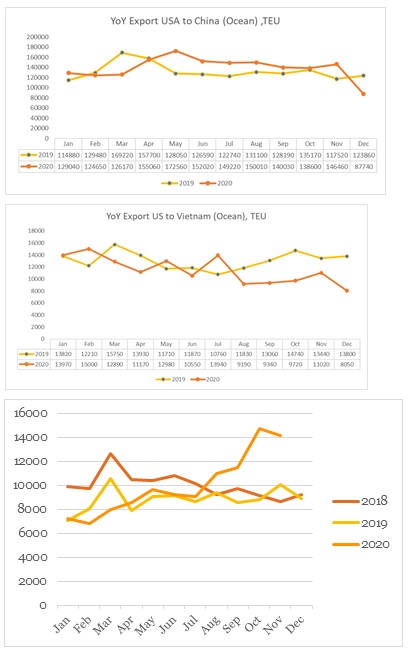
On the flip side export volume from United States into China and Vietnam markets tell a different story. From US to China the container import volume doesn’t drop until Dec 2020. While Vietnam drop YoY is more significant since June export volume dropping double digits MoM.
When expressed in (million of dollars) export value of goods from United States to China the chart shows YoY ( excluding Dec) growth of over 13% with Q4 2020 ( excluding Dec) growth averaging 47%. With growth in both TEUs and the value of goods, where is the equipment shortage coming from?
While intra-Asia and Asia-Europe trade data is not captured in this report we believe the narrative of container shortages is confusing. Where are the containers? Are the carriers that bad at managing equipment?
We believe carriers are taking advantage of tight market conditions from China to US, which is regulated by the FMC limiting equipment in order to keep PSS (Peak Season Surcharges) / GRI ( General Rate Increases) to keep Q1 rate levels high.
End Pt. 1
- Managing Director at JUSDA America